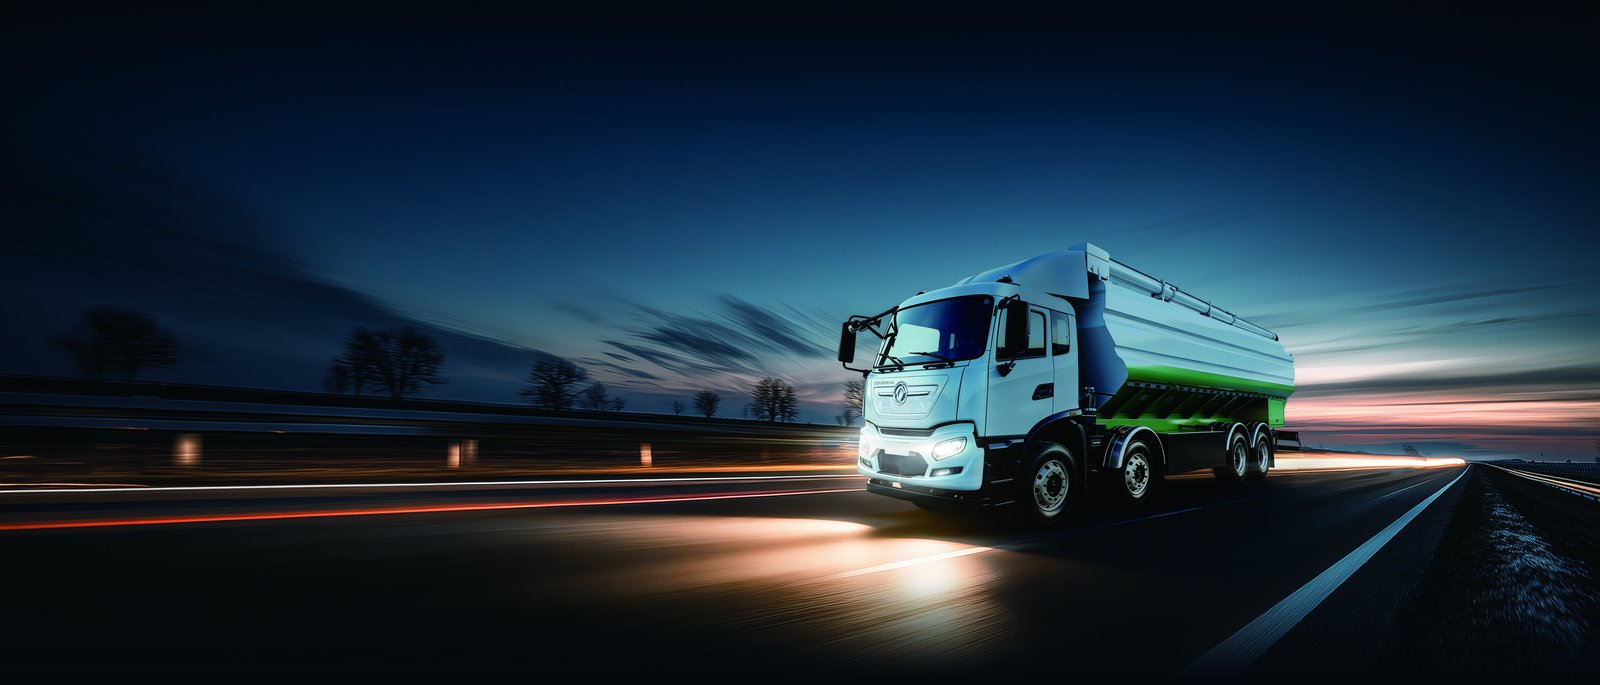
Every ready-mix operator’s first question about electric mixers is the same: “Will it keep my pour schedule?” It is the right question — concrete is perishable, plant throughput is contract revenue, and a truck that breaks the cycle costs more than its fuel savings. This article answers it with cycle math instead of reassurance: how the Dongfeng TZ8J electric mixer runs a real batching day against its diesel counterpart, where time is actually lost and gained in the cycle, and how the charging strategy maps onto the pour calendar. The short answer: on the duty cycles that define ready-mix work, the electric mixer matches the diesel’s rhythm — and wins several of its margins.
A standard ready-mix cycle has six phases: batch (5-10 min), haul-out (15-45 min), queue (0-60 min, the wild card), pour (20-45 min at the pump or chute), washout (5-10 min), and haul-back (15-45 min). The diesel mixer burns fuel through all six; its engine drives the drum hydraulically at whatever rpm the working phase demands. The TZ8J runs the same six phases with two architectural differences that change the time-and-energy math: the drum spins on an independent electric drive at constant, programmable speed — no engine-speed dependency, no hydraulic losses — and the traction system consumes zero during queue and pour phases. Nothing in the cycle is slower electrically; the question is only whether the battery covers the day.
| Cycle Phase | Diesel Mixer | TZ8J Electric Mixer |
|---|---|---|
| Batch & load | 5-10 min, engine at fast idle | 5-10 min, drum on grid-charged pack |
| Haul-out (30 km) | 35-50 min in traffic | 35-50 min — identical |
| Site queue | engine running, drum turning | traction zero; drum at 3-5 kW |
| Pour | 20-45 min, PTO at working rpm | 20-45 min, constant-speed drum — better slump control |
| Washout & return | identical | identical |
| Cycles per 10-h shift (30 km cycle) | 6-8 | 6-8 — with one 30-45 min charge on high-utilisation days |
The table’s bottom line is the answer: cycles per shift are the same. The TZ8J’s 350 kWh CATL LFP pack delivers 220-280 km of loaded mixer duty including drum load — six to eight 30 km cycles — which covers a standard shift outright. High-utilisation days (10-12 cycles, pour-critical pours) need one 30-45 minute DC charge, and the pour calendar itself provides the slot: the midday lull between the morning pour wave and the afternoon wave, when the diesel trucks are parked at the plant anyway. Charging is scheduled into a window the operation already owns; it does not take time from the pour.
Three phases genuinely improve. Pull-away and acceleration: the electric drivetrain’s instant torque moves a loaded 32 t mixer through urban traffic with less time lost at every light — our fleet data shows 2-4% shorter haul times on congested routes, which compounds to a bonus cycle on some days. The pour itself: constant-speed drum rotation gives the pump operator steady discharge without engine-rev coordination, shaving minutes per pour and improving slump consistency — quality managers notice. And the working environment: no exhaust at the pour point matters on enclosed and semi-enclosed pours (basements, tunnels, occupied buildings), where diesel mixers increasingly face restrictions that the electric mixer simply does not have.
Cycle parity is only half the story; the other half is what each cycle costs. A diesel 8x4 mixer burns 0.75-0.90 L/km equivalent on urban duty including drum and queue load; the TZ8J consumes 1.7-2.0 kWh/km all-in. At representative prices (diesel US$1.00-1.45/L, industrial power US$0.10-0.16/kWh across our deployment markets), energy cost per cycle runs US$22-32 diesel versus US$6-9 electric — a 65-75% reduction on the same number of cycles. Annualised on a two-shift plant, the saving per truck runs US$25,000-45,000 depending on market and utilisation, with maintenance (no engine, transmission, or hydraulic PTO) adding US$5,000-9,000 more. Payback on the purchase premium: 18-30 months on two-shift duty. The full platform specification is on our TZ8J model page.
The batching plant is the charger — this is what makes mixer fleets the easiest heavy segment to electrify. A 12-15 truck plant runs on two 240 kW DC chargers plus managed overnight AC, an 800 kVA-1 MVA service the plant’s industrial connection usually accommodates or upgrades to routinely. The load-management layer sequences charging around batching load and the pour calendar: overnight full charges, the midday rotation wave, and top-ups slotted into dock time. Buyers scoping plant electrification in our core markets can see deployment contexts on the Indonesia market page and regional equivalents, where plant-based mixer fleets run exactly this pattern.
The pour-schedule question dissolves under data: identical cycles per shift, a charging slot the calendar already provides, and better behaviour at the pour itself. What changes is the cost per cubic metre delivered — down 65-75% on energy, with a maintenance-light drivetrain and an emissions profile that wins restricted-site work diesel cannot touch. Ready-mix is a margin business run on schedule discipline; the electric mixer keeps the discipline and improves the margin. That is the whole case, and it is a strong one.
Cycle-time parity is the claim; the accumulated fleet data is the proof, and it is worth describing what plants report after a year of mixed-fleet operation. Utilisation records show the electric mixers matching diesel availability within a percentage point — and the misses trace overwhelmingly to process learning (a missed charge slot, a dispatch habit carried over from diesel) rather than vehicle faults. Energy records confirm the 65-75% per-cycle saving holds across seasons and route mixes. Driver records show preference consolidating toward the electric trucks within a quarter — the queue comfort, the smooth low-speed control at the pour, and the reduced end-of-shift fatigue are cited consistently. And the maintenance records tell the structural story: the electric fleet’s workshop hours per truck run at roughly half the diesel fleet’s, concentrated in brakes, suspension and drum hardware rather than powertrain.
The plant manager’s summary metric — cost per cubic metre delivered — integrates all of it, and the plants running both technologies report the gap stabilising at 20-30% in the electric fleet’s favour after the learning quarter, widening as utilisation rises. For plants considering the transition, the operational evidence suggests a low-risk sequencing: convert the highest-utilisation trucks first (the two-shift workhorses where savings and data accumulate fastest), retain diesel for the irregular long-distance outliers during the transition, and expand as the charge infrastructure and driver base grow. The pour schedule — the metric this article opened with — survives the transition intact, and the margin structure of the plant improves with every truck converted. In ready-mix, that is the whole business.
Ready to electrify your fleet? Contact Shaanxi Fenghan Trading — authorized Dongfeng EV truck exporter. WhatsApp: +86 153 1943 1311 | Email: sales@fenghan-trade.com | dongfengevtrucks.com
🌐 Our Network: Fenghan Trade (SAGMOTO/SHACMAN Truck Export) · heavy duty mining dump truck 6x4 8x4